Excel vs Tableau: two tools that are used for data analysis and each one takes a different approach to exploring data and finding key insights. If you’re storing your data in Excel and you’re tired of writing formulas, Tableau can bring it all together and make the exploration of data faster and easier. Their drag-and-drop analytics will answer deeper questions and rather than sending reports, with Tableau you can centralise, collaborate and explore shared data and dashboards.
Excel is used to add, collect, store, track and sort data, and to perform various financial, mathematical and statistical operations. But while Excel comes equipped with many features that help you get started with data, Tableau takes your analysis to the next level with flexible, responsive visuals and best of all, Tableau natively connects to Excel spreadsheets to make data analysis simple and fast.
You can combine and integrate data
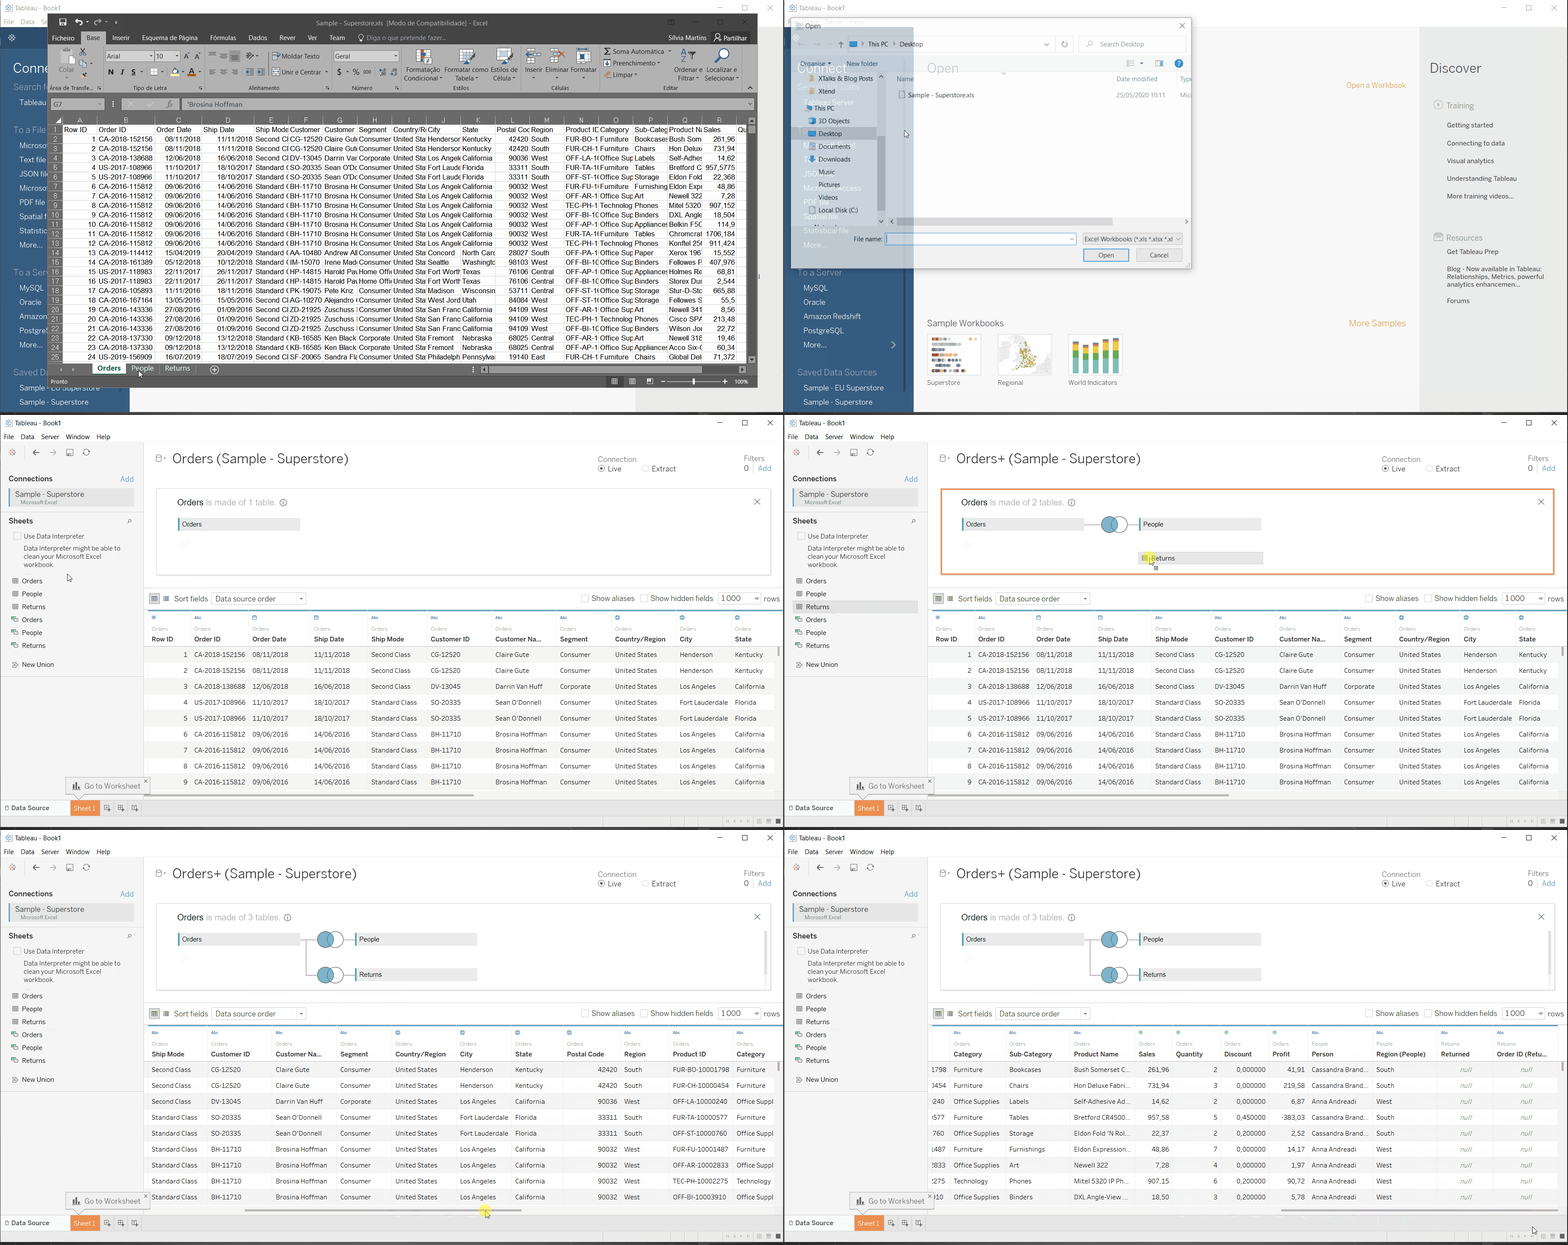
In Excel you will handle millions of rows of data scattered across different workbooks, which makes working out your data story overwhelming. You might find yourself lost, spending hours searching for the data you want to focus on. While Excel is great for storing your data, Tableau can easily pull together all the data that you have, not only in Excel, but also connecting live with any relational database such as Salesforce, LinkedIn, Google Sheets, Google Analytics or Spark. You can easily analyse data from a combination of data sources, tables, worksheets and workbooks all at once. With Tableau you save time because you can explore and have a complete view of your data. With drill-down and data blending features built in, you’re able to spot new patterns, trends and correlations, and then understand what caused them to happen.
Your data is up to date in no time
Excel and Tableau can work with static and live data from multiple data sources. However, automatically refreshing data in Excel involves manually programming processes or creating steps that automatically update your sheet’s data when you open your file. When a user doesn’t have skills with live connections, typically it becomes a copy paste process that can lead to errors. With Tableau you can easily set up a live connection to your data that allows to you to have a real time usage of your visualisations.
You can build charts and even more insightful visualisations
In Excel, you need to have a reasonable idea of the answers to your questions before deciding which chart best displays the results of your analysis. Even after you think you’ve made the right decision about which chart to use the data may change; there may be additional information available to help with your analysis; or the results of your chart may not look the way you expect, or answer the question properly. In such cases, you often have to start over and update your file. Tableau is more intuitive with this process; for example, when creating calculations, the formula will be applied to all rows referencing that source. This makes it easier to create and apply recurring processes. And with visualisations, Tableau visualises data from the start, allowing you to see the significance right away. Tableau differentiates correlations using colour, size, labels and shapes, giving you context as you drill down and explore on a granular level.
You can have even richer analytics
In addition to a smart calculation language, Tableau has a number of built-in features to help you get your data into a structure and format you and others can use. These analytics allow you and others to explore data at will. Quickly reveal and isolate outliers, discover hidden patterns, see trends, show geographical locations and model the future so you can anticipate results. With Tableau you can analyse your data without worrying about it becoming corrupt, or losing hours and hours of work because someone accidentally deleted one of your formulas. The data never writes back to your original data source and Tableau lets you ask questions and allows the answers lead you to new insights.
You can share and collaborate
When it comes to analysing data and sharing insights, credibility and trust around what is being reported are the two most important key factors to consider. Using Excel users often find themselves duplicating reports, losing track of their location and versioning or having different business users report on the same KPI with different formulas. Tableau can help you govern your data and eliminate these problems so your company can share a single version of the truth.
With Tableau Server or Tableau Online, your data is centralised and available on the web, giving your data the power to make an impact. Simply publish and share visualisations and dashboards with the people you want to collaborate with, allowing them to answer questions, collaborate with others and further share your data analyses. Sharing in Tableau allows everyone in the organisation to use the same metrics and the same version of reports, avoiding problems typical governance problems.
Excel vs Tableau: in summary
If you’re working with lots of data, it’s better to work from a centralised database, but if you’re not, you can use Excel as a simple data repository and use Tableau for visual analyses. Whenever you need to insert new data, you can insert it manually using Excel or use our Write-Back extension for Tableau, which allows to any user add new data to any report directly from Tableau.
To know more about how to combine Excel and Tableau, please click here.

Data Analytics Engineer – Xpand IT

