5 SECONDS-SUMMARY:
- There are some steps to getting a framework to work properly;
- Ingestion, Processing, Azure DevOps, Monitor.
Nowadays, every company has data needs. The way that data is treated and governed has a lot of processes that can be overwhelming at some point. Sometimes, when working with company data, your employees, especially developers, can see themselves developing the same processes or data pipelines for different projects. This is why an organised structure like a framework is so important.
With it, you can standardise your processes in order to better control and monitor your data pipelines.
This approach will help with establishing best practices and avoiding turning your data lake into a data swamp while at the same time keeping the specific business logic for each data pipeline independent – meaning that you will still be able to handle each data set uniquely and get the most information out of it. There are some steps to getting a framework to work properly, so let’s see them.
Ingestion
Data ingestion is a crucial step in any data processing pipeline and one that must be replicated many times to gather all the necessary data. Using a well-designed framework to ensure that the data is efficiently extracted from various sources and loaded into the target data storage, you can ensure that you always know how many rows have been imported and where the data landed – and have a concise, robust process with a single point of change to cope with future changes.
Normally, the data ingestion framework extracts data from different sources, like SQL Server databases, .csv files, etc., that can be loaded into cloud storage, such as Azure Data Lake Storage (ADLS) Gen 2. This step is where the connections of data sources are made and where the data is prepared to be ingested into storage. In addition, it’s during this step that the load logic is configured, whether it’s a full or incremental load. Basically, it means that you can retrieve all the data every time your process runs or retrieve only new data.
Keeping raw data in the storage means that for the next step, which is processing, all data is available even if not immediately used, meaning later, you can take advantage of unused fields and achieve comprehensive data tracking.
Processing
Transforming data into structured tables is a critical step in the analytical process. Once the data ingestion process is complete, the next step is to process and transform the data into a structure that can be used for analytical purposes to achieve effective data analysis.
These data pipelines work to clean and maintain data quality and perform calculations, especially the ones you need, which normally are KPIs – and while doing this, provide alerts if something goes wrong when the process runs. While most of the transformations will be specific to the business model being processed, there are logical recurrent tasks, such as monitoring data quality and execution or even deleting data for reprocessing. These recurrent tasks can be standardised, allowing data engineers to easily fit any specific business logic into the process.
Let’s use the Azure Synapse example. After data ingestion, this data is accessed using external tables that read the ADLS Gen 2 directory, where the files for a specific table are stored. To process and transform data, two types of processing pipelines can be developed, one to create dimensions and the other to create fact tables. Both processes make use of Synapse’s Data Flow tool, which is a cloud-based data transformation tool that allows users to create and manage large-scale data transformation operations.
When the data flow is finished, the result is a SQL table that is saved in the Synapse Dedicated Pool. Those tables can be used for analytics solutions like Power BI dashboards which include a connection for a Synapse Dedicated Pool that allows users to import tables or do direct queries.
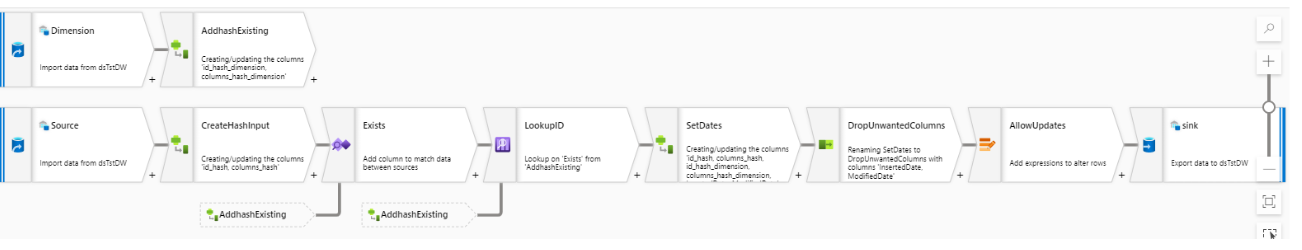
Example of a simple fact table processing using data flow
Azure DevOps
Azure DevOps is a collection of technologies that offers a complete solution for agile development and DevOps. This suite contains numerous technologies that can assist developers in managing the whole development process, including version control, continuous integration and continuous delivery. Regardless of the development approach, leveraging several environments is an industry-recognised best practice. This ensures that any created information is thoroughly evaluated, both technically and by business users before it is made public or applied in a production context.
Normally those environments are Development, Testing or Quality Assurance (QA) and Production. In the Development environment, data engineers develop and build pipelines. When these pipelines are in a working, stable state, they are then promoted to the QA environment, where the outputs can be tested by the end users and/or developers. If no further development is needed, the pipelines can be deployed to Production.
While data pipelines are developed differently from code, it doesn’t mean that you should leave DevOps out. In an Azure Synapse Analytics workspace, Continuous Integration/Continuous Delivery (CI/CD) moves all entities from one environment (development, QA, production) to another environment. These templates will be used to deploy your features in the QA and Production environments.
This approach provides several advantages. Firstly, it minimises the impact of changes made by other teams/developers. Secondly, downtime and risk are minimised if development and testing are done on dedicated environments. Finally, security and permissions can be restricted to each environment to reduce the risk of human error and data loss and protect sensitive data.
Monitor
Monitoring is another crucial part of the Synapse framework, and to assist in this area there’s also the Azure Monitor tool. Using the Kusto Query Language (KQL), it’s possible to query the logs in near real-time and set up alerts via email that the synapse workspace admin will receive every time a pipeline run fails.
The framework is also capable of storing the logs from Azure Monitor into an ADLS Gen2 Container to keep the historical data and consuming them in Power BI to create a report about those logs. Logs include execution statistics and messages. The ingestion and processing phases of the framework gather functional statistics of execution and store them in the logs too.
Power BI is then used to do ad-hoc analysis to understand, for instance, which pipelines can take longer, whether was there any deviation on rows processed or other functional statistics, which one fails often, understand when the dedicated pool is hitting the max usage, or even creating combinations where the number of rows processed is divided by time to understand whether the process took longer than usual.
Implementing Azure Monitor, it helps to minimise risks, improve the quality of the processes and ensure that our pipelines are performing as expected.
Final thoughts
Having a framework for your data pipelines is really an advantage since it provides standardisation and scalability. Having a framework that runs all your data pipelines makes the process simpler and more efficient because your developers don’t have to waste time defining properties for each individual pipeline but can change their working environment, for example, from development to QA. Having everything running in one place provides more control over the quality of the process and more power to monitor everything properly so that when an issue arises, your developers are alerted by the framework and can check the necessary logs to understand what happened and solve errors faster.
Besides this, imagine having to scale all your data pipelines one by one. With the framework, you can scale all of them in one go just by changing the properties of the framework instead of each pipeline individually.