José Miranda

jmdm

Data Analytics Engineer

Mit dbt die Macht der Daten erschließen

DIESER ARTIKEL IN 5 SEKUNDEN:
  • dbt stellt einen Paradigmenwechsel in der Art und Weise dar, wie Unternehmen an die Datentransformation herangehen;
  • In diesem Artikel erfahren Sie, was dbt ist, was dbt mit Daten macht, was der Unterschied zwischen dbt Core und dbt Cloud ist und welche Vorteile Sie haben, wenn Sie dbt sofort einsetzen.

In der heutigen datengesteuerten Welt suchen Unternehmen ständig nach innovativen Lösungen, um ihre Daten-Workflows zu optimieren und wertvolle Erkenntnisse zu gewinnen. Hier kommt dbt ins Spiel – eine revolutionäre Technologie, die unter Datenexperten immer beliebter wird, weil sie die Art und Weise, wie Unternehmen ihre Daten verwalten und nutzen, verändern kann.

dbt stellt einen Paradigmenwechsel in der Art und Weise dar, wie Unternehmen die Datentransformation angehen, und bietet eine moderne, kollaborative und effiziente Lösung für die Verwaltung von Datenpipelines. Unabhängig davon, ob Sie sich für eine Cloud-Lösung mit einer verwalteten Plattform entscheiden oder dbt in einer On-Premises-Lösung für eine bessere Kontrolle einsetzen, kann dbt zweifellos den Wert Ihres Unternehmens steigern und die datengesteuerte Entscheidungsfindung beschleunigen.

Was dbt für Daten tut

dbt, kurz für data build tool, ist ein Open-Source-Befehlszeilentool, mit dem Datenanalysten und -ingenieure die Daten in ihren Warenhäusern effektiver umwandeln können. Es konzentriert sich hauptsächlich auf das T (Transformation) des ETL- oder ELT-Prozesses und ist für die Bearbeitung von Daten nach dem Laden vorgesehen. Das Hauptmerkmal dieses Tools ist die Kombination von Jinja-Vorlagen mit SQL und wiederverwendbaren Modellen.

Das Tool bietet außerdem mehrere Funktionen, die die Arbeit mit Daten erleichtern. Zu diesen Funktionen gehören die Verwaltung von Abhängigkeiten zwischen Datenmodellen, die Durchführung von Tests zur Sicherstellung der Datenintegrität und die Verfolgung des Verlaufs von Daten, um zu verstehen, wie sie im Laufe der Zeit verändert wurden.

Warum sollten Sie das dbt verwenden?

  1. Einfachheit, Modularität und wiederverwendbarer Code: Mit seinem SQL-basierten Ansatz vereinfacht dbt den Datentransformationsprozess und macht ihn für Benutzer mit unterschiedlichen technischen Kenntnissen zugänglich. Darüber hinaus fördert dbt die Modularisierung und ermöglicht es den Benutzern, komplexe Transformationen in kleinere, wiederverwendbare Komponenten zu zerlegen, was die Wartbarkeit und Skalierbarkeit verbessert.
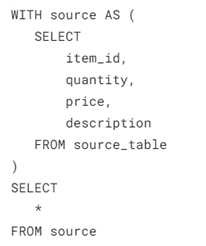
modelo-dbt-simples

Beispiel für ein einfaches dbt-Modell

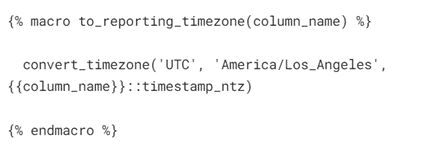
macros-dbt

dbt ermöglicht Ihnen die Verwendung von Makros zur Wiederverwendung von Code

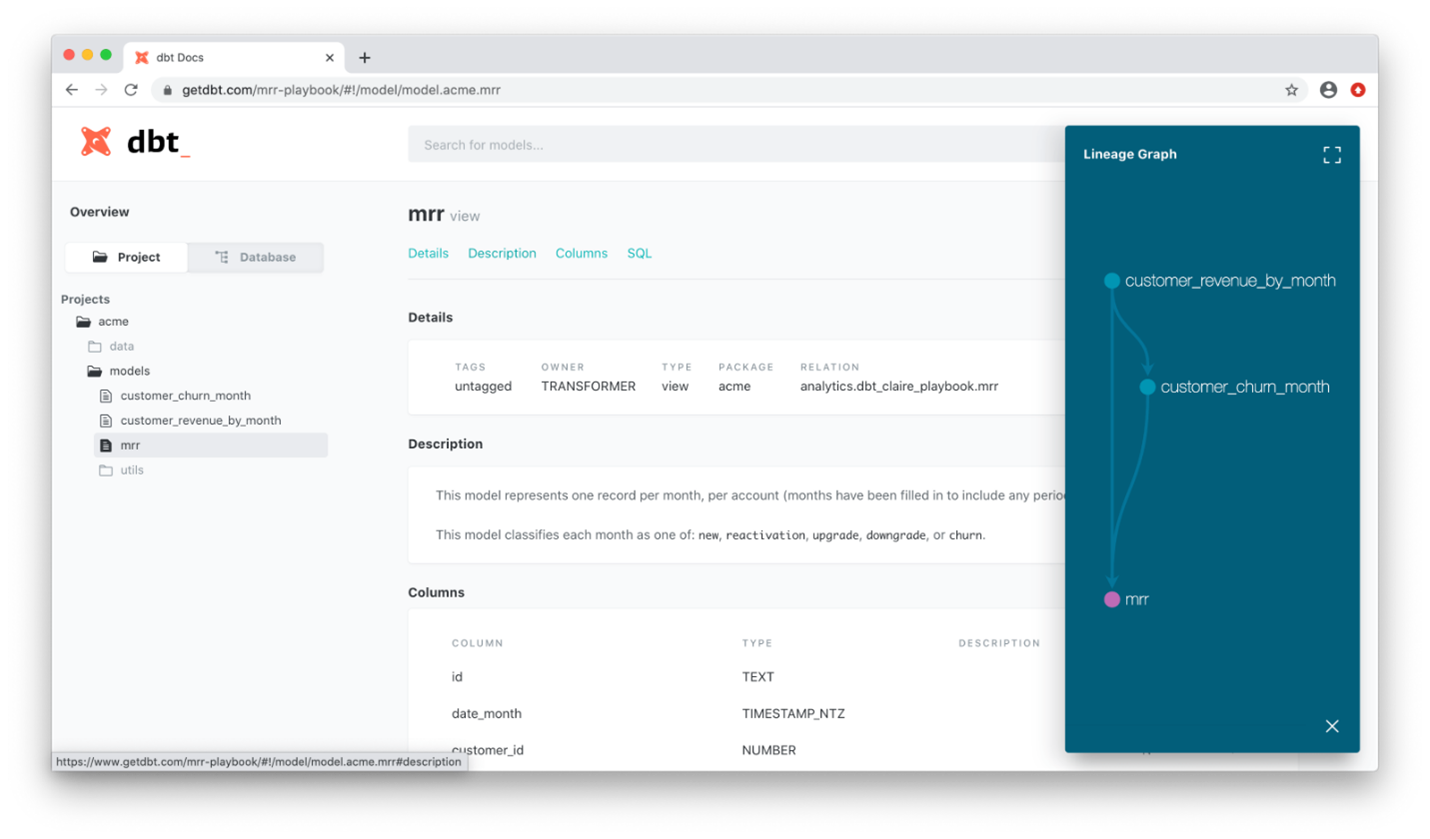
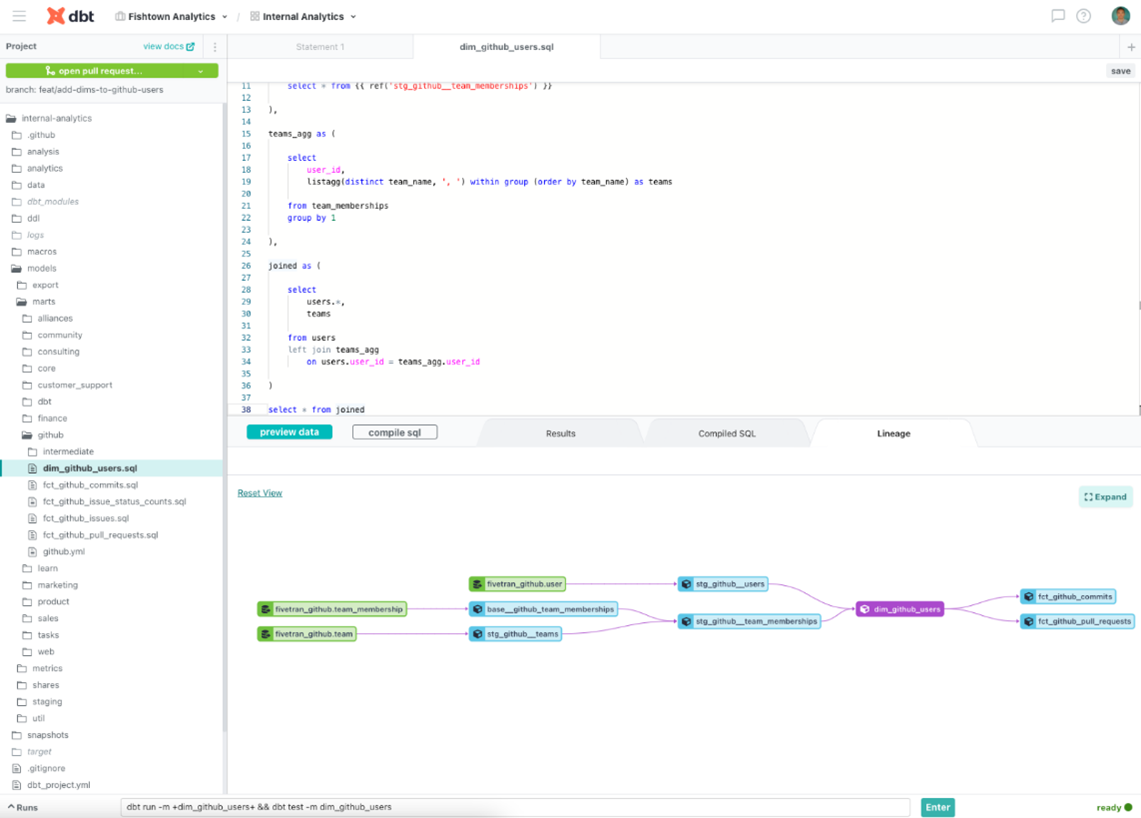
  1. Benutzerfreundliche UI: Die einfache, intuitive Benutzeroberfläche ermöglicht es Teams, gemeinsam zu arbeiten, indem sie Versionskontrollsysteme wie Git nutzen, um Änderungen an ihrem Datenumwandlungscode zu verfolgen. Außerdem wird automatisch eine Dokumentation für Ihre Datenmodelle erstellt. Diese Dokumentation enthält Text- und Grafikinformationen über die Datenquellen, Transformationen und alle mit dem Modell verbundenen Tests.
dbt-cloud-ui

dbt Cloud UI Dokumentationsseite. Quelle.

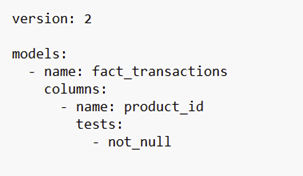
  1. Testen: dbt enthält ein Test-Framework, mit dem Sie Tests für Ihre Datenmodelle definieren und durchführen können. Dies stellt die Integrität und Qualität Ihrer Daten sicher und hilft, Probleme frühzeitig in der Pipeline zu erkennen.
dbt-testes-ficheiros-yml

Beispiel für die Implementierung generischer Tests in .yml-Dateien

4. Automatisierung und Integration mit Datenquellen: Mit dbt können Anwender ihre Datentransformations-Workflows automatisieren, was den manuellen Aufwand reduziert und die Zeit bis zur Einsichtnahme beschleunigt. Außerdem lässt sich dbt nahtlos in verschiedene Datenquellen und -lager integrieren, darunter Snowflake, BigQuery, Redshift und andere, so dass die Benutzer ihre bestehende Infrastruktur nutzen können.

5. Unterstützung durch die Gemeinschaft: dbt verfügt über eine lebendige Gemeinschaft von Benutzern und Mitwirkenden, die aktiv Best Practices austauschen, zur Entwicklung zusätzlicher Pakete beitragen und über Foren und Slack-Kanäle Unterstützung leisten.

dbt Core vs dbt Cloud

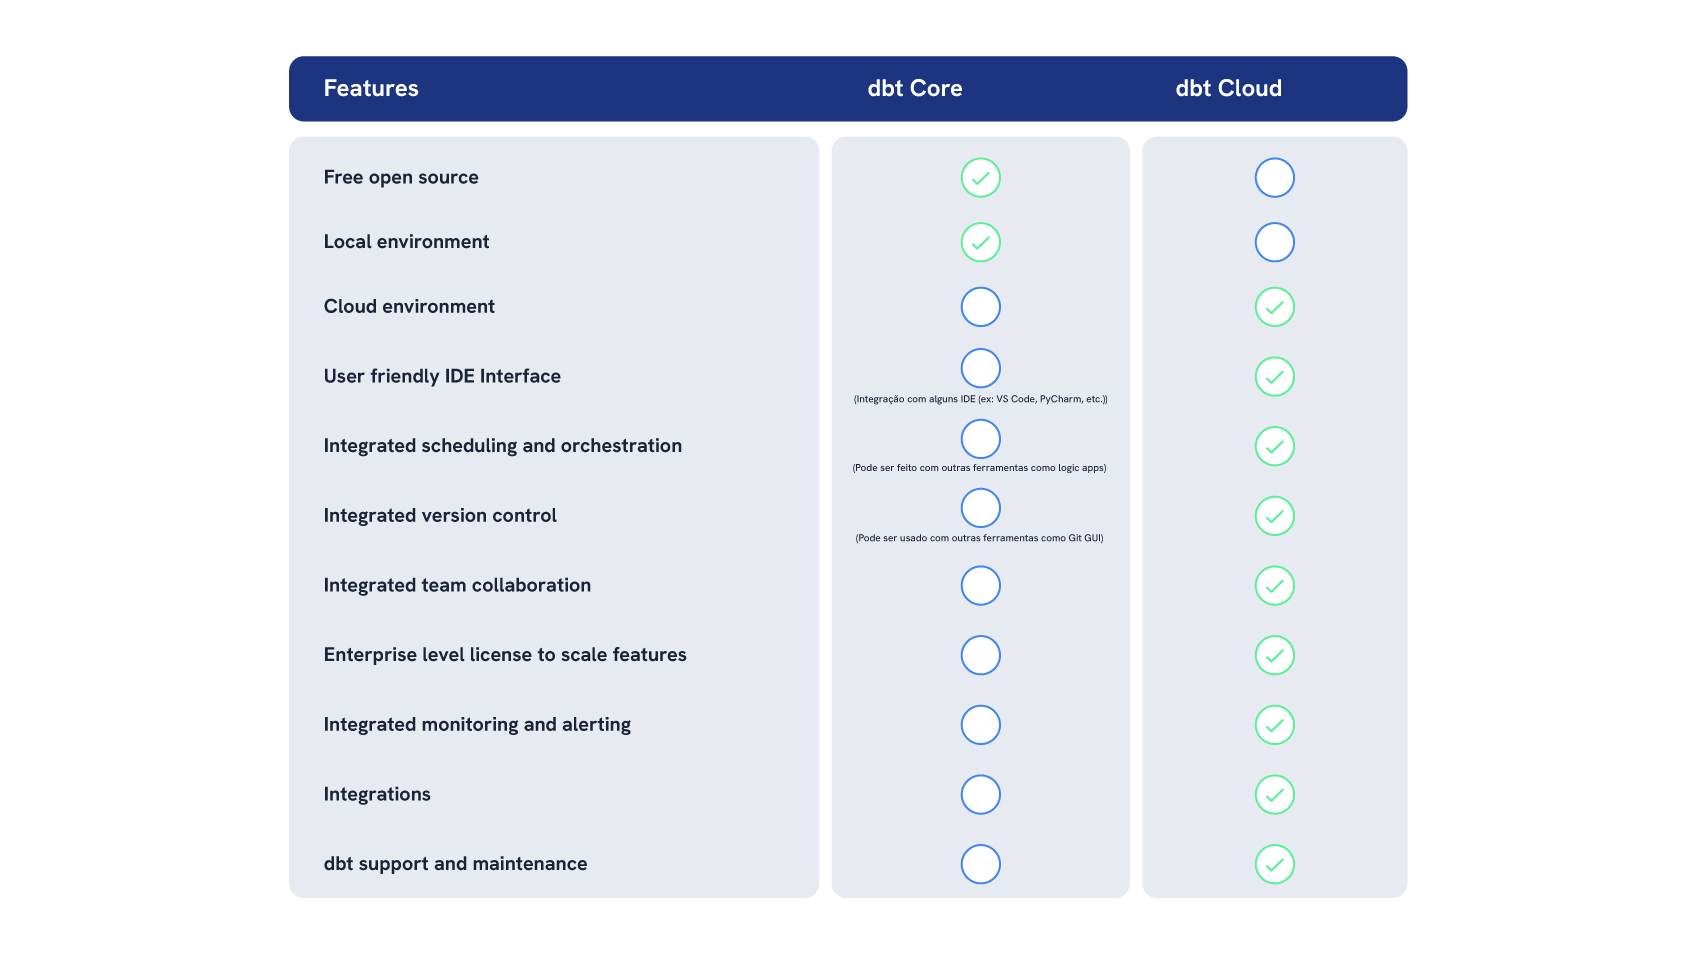
Wenn Sie sich entschieden haben, dass dbt das Richtige für Ihr Unternehmen ist, müssen Sie im nächsten Schritt festlegen, wie Sie auf dbt zugreifen wollen. Die beiden gängigsten Methoden sind eine kostenlose Version namens dbt Core, die Sie lokal implementieren können, und eine kostenpflichtige Version namens dbt Cloud, mit der Sie eine vollständige Cloud-Lösung nutzen können. Es ist wichtig, die Unterschiede zu verstehen, um das richtige Tool für Ihre spezifischen Datenumwandlungsanforderungen zu wählen. Während Sie mit dbt Core Ihre Lösung lokal haben, müssen Sie verschiedene Funktionen mit anderen Tools abgleichen. Mit dbt Cloud haben Sie alle Funktionen und Möglichkeiten zentralisiert.

dbt-core-vs-cloud
dbt-cloud

dbt CloudUI. Quelle.

dbt-core

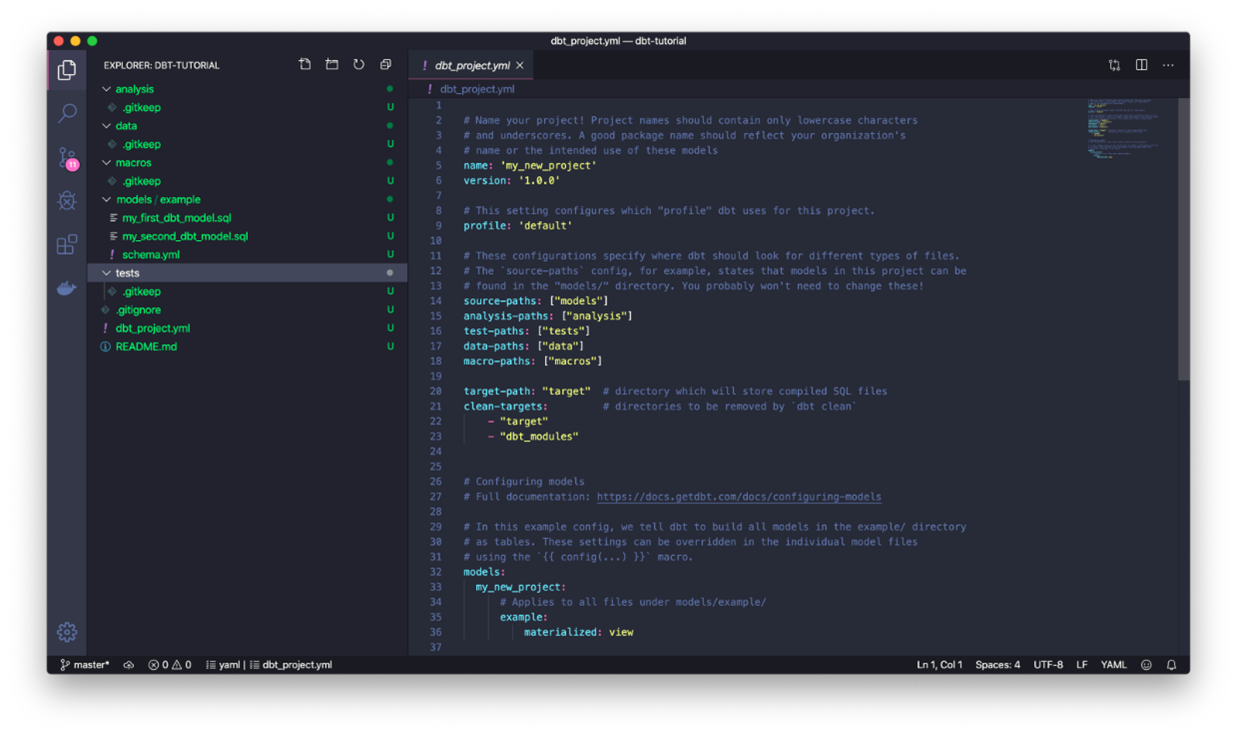
dbt-Kern in der IDE. Schriftart.

Abschließende Überlegungen

Es ist wichtig zu erkennen, dass dbt nur ein Teil einer gut definierten Datenstrategie ist. Eine optimale Datennutzung ist eine Herausforderung, die mit der Zusammenstellung eines Teams mit den richtigen Fähigkeiten, der Auswahl geeigneter Tools und der Festlegung relevanter Kennzahlen einhergeht. Selbst mit diesen Ressourcen kann es für Unternehmen schwierig sein, Daten effektiv zu nutzen.

Bei der Empfehlung von dbt ist es wichtig zu betonen, wie wichtig eine solide Basisinfrastruktur mit qualifizierten Teams, geeigneten Tools und effizienten Prozessen für den Datenerfolg ist. Und wenn Sie nicht wissen, wo Sie anfangen sollen und wie Sie eine leistungsfähige Grundlage für den Datenerfolg schaffen können, können wir Ihnen helfen.

Sind Sie bereit, das volle Potenzial Ihrer Daten zu erschließen? Starten Sie Ihre dbt-Reise noch heute!

José MirandaMit dbt die Macht der Daten erschließen
read more

Data Governance mit Microsoft Fabric

DIESER ARTIKEL IN 5 SEKUNDEN:
  • Microsoft Fabric revolutioniert die Welt der Datenanalysen mit endlosen Möglichkeiten.
  • In diesem Artikel erfahren Sie, wie Sie mit Microsoft Fabric die Data Governance optimal sicherstellen können.

Es ist offensichtlich, dass Microsoft Fabric in der Welt der Datenanalyse auf dem Vormarsch ist. Fabric ist eine Microsoft-Lösung, die eine breite Palette von Datenwerkzeugen und -funktionen vereint und eine große Hilfe für alle darstellt, die ständig mit Daten arbeiten und diese verwalten müssen. Deshalb werden wir heute erklären, wie Governance in Fabric funktioniert. Das ist ein wichtiges Thema in der Welt der Daten, denn ohne Governance kann eine ganze Datenstruktur zusammenbrechen. Doch was ist Governance überhaupt?

Data Governance ist der Prozess, der sicherstellt, dass Daten sicher, privat, genau, zugänglich und nutzbar sind.

Im Rahmen dieser Definition bietet Fabric eine Vielzahl von Möglichkeiten, dies zu erreichen. Wir werden versuchen, sie zusammenzufassen und zu erklären, wie sie für Sie nützlich sein können.

1) Datenbestand

Es gibt eine Struktur in Fabric, die bei der Verwaltung des Datenbestands hilft, aber die wichtigsten Ressourcen, wie z. B. Kapazitäten, werden im Azure Portal definiert, wo Ressourcen einem bestimmten Tenant hinzugefügt werden.

Es gibt auch ein Administrationsportal innerhalb von Fabric, über das Administratoren allgemeine Einstellungen wie Domains und Workspaces, Kapazitäten und die Interaktion der Benutzer mit Fabric verwalten können. Apropos Domains und Workspaces: Mit ihnen lässt sich steuern und festlegen, wer Zugriff auf bestimmte Elemente und Informationen hat. Dies ist eine Art Data Mesh-Ansatz, bei dem Sie einen Tenant für eine Organisation haben und innerhalb dieses Tenants mehrere Workspaces einrichten können. Aber wo sind die Domains?

Als Fabric-Administrator haben Sie Zugriff auf das Verwaltungsportal, um die verschiedenen Domains zu konfigurieren, die im Wesentlichen eine logische Gruppierung von Arbeitsbereichen unter einem Thema, einem Abteilungsnamen oder einer anderen Gruppierung sind. Angenommen, ein Unternehmen hat Hub- und Nicht-Hub-Abteilungen. Es müssen Arbeitsbereiche für diese Abteilungen und Domains für Hub und Nicht-Hub erstellt und die jeweiligen Abteilungen (Arbeitsbereiche) jeder Domain zugeordnet werden. Jedem Benutzertyp auf jeder Ebene können Berechtigungen und Rollen zugewiesen werden.

Eine weitere nützliche Funktion ist das sogenannte Metadaten-Scanning, das die Verbindung zu externen Katalogisierungswerkzeugen über Scanner-APIs unterstützt. Diese APIs extrahieren Metadaten aus Fabric-Elementen, sodass Sie diese katalogisieren und Berichte darüber erstellen können.

2) Entdeckung und Vertrauenswürdigkeit der Daten

Eine der großen Stärken von Fabric ist die OneLake-Datendrehscheibe, die das Auffinden und die Interaktion mit Datenelementen erleichtert. Dieses Tool bietet Informationen zu jedem Element und Filteroptionen, um relevante Daten zu finden.

Ein weiteres Feature ist die Möglichkeit, Inhalte zu genehmigen. Auf diese Weise können Sie Datenelemente zertifizieren, sodass Sie diese den Nutzern anbieten können und diese bei ihrer Suche zuverlässige und qualitativ hochwertige Elemente finden.

In derselben Logik haben wir die Datensequenz und die Auswirkungsanalyse. Dabei handelt es sich um eine Funktion von Fabric, mit der Sie den Datenfluss von der Quelle bis zum Ziel und deren Beziehungen visuell verfolgen können. Darüber hinaus können Sie für jedes Element in der Lineage-Ansicht sehen, welche Elemente von Änderungen betroffen sind, und andere Benutzer warnen, dass eine Änderung Auswirkungen auf ihre Arbeitsobjekte haben könnte. Wenn Sie beispielsweise eine Spalte in einem semantischen Modell ändern, können Sie eine Warnung an Power BI-Benutzer senden, um sie über die Änderung des von ihnen verwendeten Elements zu informieren.

3) Compliance und Datensicherheit

Die Aufrechterhaltung der Datensicherheit und des Datenschutzes ist manchmal komplex, aber Fabric bietet viele Funktionen für diesen Bereich. Darüber hinaus lässt es sich gut mit Microsoft Purview skalieren und bietet sogar einige Purview-Funktionen innerhalb von Fabric.

Eine dieser Funktionen ist die Kategorisierung von Daten, um die Anforderungen an Datensicherheit und Datenschutz zu erfüllen. Sie können die in Fabric integrierten Funktionen oder die Purview Information Protection-Kategorien verwenden, um sensible Daten automatisch oder manuell zu kategorisieren. Mit Purview können Sie diese Kategorisierung auch dann beibehalten, wenn die Daten mit den unterstützten Exportmethoden aus Fabric exportiert werden.

Ein weiterer Punkt ist die Überwachung der Benutzeraktivitäten wie Zugriffe, Anmeldungen oder Aktionen in verschiedenen Tools wie Power BI, Spark, Data Factory usw. Dies kann intern mit Fabric durch Aktivieren von Azure Log Analytics und Einrichten einer Audit-Log-Rolle für den Zugriff auf die Protokolle oder durch Verwenden einer anderen Purview-Funktion namens Purview Audit erfolgen.

Es gibt viele Dinge, die Sie in Fabric tun können, um Sicherheitsprobleme zu vermeiden, aber eine davon ist, Arbeitsbereiche und Rollen gut zu organisieren. Fabric ermöglicht es Ihnen, Berechtigungen speziell für Arbeitsbereiche und deren Elemente zu vergeben. Darüber hinaus gibt es Möglichkeiten und Ressourcen, um RLS (Row-Level-Security) zu erstellen und sicherzustellen, dass jeder Benutzer nur die Daten sieht, die für den jeweiligen Benutzer oder die jeweilige Benutzergruppe relevant sind. Man muss nur wissen, welche Benutzer- und Gruppenstruktur das Unternehmen haben wird, und all diese Funktionen nutzen.

4) Überwachung

Es ist wichtig zu wissen, was passiert und wie sich Fabric verhält. Die wertvollen Informationen, die Sie aus Monitoring-Ressourcen extrahieren können, helfen Ihnen, Ihren Tenant effizient zu verwalten und unnötige Kosten zu reduzieren.

Eine solche Ressource ist der Monitoring Hub, in dem Benutzer wie Techniker und Entwickler die Fabric-Aktivitäten zentral und auf Wunsch auch historisch einsehen können. Überwacht werden können Workflows, Datenpipelines, Datenströme, Data Lakes, Notebooks und vieles mehr. Darüber hinaus gibt es Admin Monitoring, eine Funktion, die speziell für Administratoren entwickelt wurde, um Aufgaben wie Audits und Nutzungstests durchzuführen.

Eine zusätzliche Funktion sind die App Capacity Metrics, mit denen Sie die Leistung von Fabric in Bezug auf Ressourcenauslastung und -verbrauch bewerten können. Diese Funktion ist in der Regel für Administratorrollen vorgesehen.

Schließlich gibt es noch den Purview Hub. Dabei handelt es sich im Wesentlichen um eine Seite in Fabric, die Administratoren dabei hilft, Berichte mit Einblicken in ihre Elemente zu sehen, insbesondere wenn es sich um sensible und genehmigte Daten handelt. Es ist auch eine Möglichkeit, sich mit erweiterten Funktionen zu verbinden, wie wir sie in anderen Themen besprochen haben.

Warum Purview verwenden, wenn Fabric über eigene Funktionen verfügt?

Da Purview über einige zusätzliche Funktionen und Möglichkeiten verfügt, können Sie die Art und Weise, wie Sie Daten katalogisieren, kategorisieren, genehmigen und schützen, verbessern, indem Sie Purview zusammen mit Fabric für das Datenmanagement verwenden.

Schlussbemerkungen

Data Governance wird mit der Zeit immer mehr zum Trend. Datenlösungen werden immer robuster und realistischer, und damit werden auch die Datenstrukturen immer größer und komplexer. Eine Datenlösung kann im Handumdrehen exponentiell wachsen, und Data Governance ist immer noch der beste Weg, um Sicherheits- oder Datenqualitätsprobleme zu vermeiden.

Da Fabric immer mehr in der Welt Fuß fasst, ist es wichtig, seine Fähigkeit, mit komplexen Daten und Anforderungen umzugehen, in Betracht zu ziehen.

Wir bei Xpand IT sehen Microsoft Fabric als ein robustes Tool, das jedes Unternehmen auf dem Weg zu einer datengetriebenen Kultur unterstützen kann, indem es eine Komplettlösung nicht nur mit analytischen Workloads, sondern auch mit Data-Governance-Tools bietet. Aus diesem Grund spezialisieren wir uns zunehmend auf die Funktionen und Möglichkeiten von Fabric, um alle unsere Kunden auf ihrer Datenreise zu unterstützen.

José MirandaData Governance mit Microsoft Fabric
read more

How to migrate SQL Server Integration Services

5 SECOND-SUMMARY:
  • Learn how to migrate SQL Server Integration Services whilst respecting the best practices;
  • Discover the advantages, such as scalability, integration with many tools, and integration with PaaS services;
  • Learn how to avoid potential issues, such as the initial complexity, the cloud costs, and not taking full advantage of cloud modules.

We all know not everything is forever. SSIS (SQL Server Integration Services) was and is a tool used by many people and companies, but like every technology, it must evolve. That evolution happened gradually with the appearance of cloud technologies and especially Azure and nowadays you can have all SSIS capabilities in Azure Data Factory allied with many more tools. For those companies who have solutions built with SSIS should think to evolve to Azure and expand their data governance and analysis. This can be achieved with some work because you can migrate the solutions you have made with SSIS to Azure.

1. Preparation for migrate SQL Server Integration Services

Ensure that you have everything ready to do this migration. Let us make a list:

a. Guarantee that you have all Azure infrastructure created before starting to do the migration and an instance of SSIS. This is because Azure has a lot of permissions that should be defined to ensure security and data access only to the people allowed to;

b. Install SSIS pack features to Azure to prevent errors or bugs while connecting to SSIS projects to Azure;

c. Create a new ADF (Azure Data Factory) instance and configure SSIS so you can create the pipelines to run your projects;

d. Change all your SSIS project connections from local bases to Azure database and change all the steps from SSIS to the steps of Azure;

e. Configure an Azure-SSIS Integration Runtime so you can run all cloud converted SSIS projects;

f. Before migrating, analyze all your SSIS projects, see their needs and dependencies. Run the projects and see if they are really reading and writing. Sometimes they give success, but they are doing nothing;

g. Deploy all your projects so they can be stored in the SSIS Catalog and validate if everything is working properly.

2. Advantages

As you know, using Azure gives great scalability to your projects and to the way you govern data and as such it has advantages:

a. Scalability: Azure gives you the ability to define computation resources to your needs;

b. Integration with many tools: You can always use other tools and resources depending on what you need, like, Azure Blob Storage, Azure Data Lake, etc;

c. Integration with PaaS services: Azure can be integrated with other platforms like Azure Machine Learning or Azure DataBricks where you can create more advanced data pipelines;

3. Disadvantages

Azure has a lot of advantages but there are some questions too like:

a. Initial complexity: The migration of SSIS projects can be complex and take some time, depending on the number of projects you have and their dependencies;

b. Cloud costs: Since you are migrating your projects from local to cloud, you still have costs, which if not managed can be high;

c. Not taking full advantage of cloud modules: Direct migrations cannot capture all the benefits, for that you should consider a process reengineering that leverages ADF or even Azure Synapse. In this case you might even be able to optimize further costs.

This is a fast and awesome solution for you to migrate from an on-prem architecture to a cloud solution, but, even so, we know that if you wanted to migrate your data pipelines to Azure using another tool it would be a solution too, with a little more work and investment but with a great increase of innovation and agility since you would be evolving your technology stack and cost reduction in the end. What we are saying is that you can reengineer your processes on another tool like Microsoft Fabric, Synapse, DataBricks or Azure Data Factory while enjoying all Azure capabilities. This means that the logic would be similar, but the components different, in fact, by using different components from DataBricks or Azure Data Factory and being some of them more efficient, your logics would change to smaller and faster pipelines which would result in less processing time, resources and costs.

Final Thoughts

Using Azure requires some effort, but it brings more value too as you can have all your SSIS projects in the cloud, working properly, well organized and stored and all your data protected with the right layers of security and permissions. This means you can stop managing your on-prem implementation, saving time and money. In the end, it is something that will increase the agility of your data projects and make you evolve to cloud solutions where you can expand your resources and the tools you need to improve the quality of your projects and data. This can even be the starting point for a full process reengineering using technologies such as Microsoft Fabric that will allow leveraging all benefits from cloud analytics. Our team of experts can help you go through this process, defining what is the best strategy for your specific context and then implementing the cloud migration.

José MirandaHow to migrate SQL Server Integration Services
read more

DataOps and non-automated data processing

5 SECONDS-SUMMARY:
  • DataOps is a conjunction of practices, frameworks, architectural patterns and cultural norms, and its purpose is to help you mitigate the obstacles that prevent you from managing data with quality and efficiency.
  • DataOps can bring significant benefits linked to its three main principles: Agile, DevOps and Lean Manufacturing.

1. Agile

For a company to be collaborative and innovative, especially in terms of data, DataOps uses Agile Development so that teams can work together with users in sprint basis and recurrently redesign their priorities if needed to achieve the evolution of requirements and continuous feedback from users. This is a best practice when responding to data requirements because business needs can change frequently, and this methodology helps all teams to evolve the solution steadily, especially when we speak about DataOps. The way an analytics solution will be implemented and the time it will take, for sure, depends on how tasks are organized, continuous validation of results, mitigation of errors and requirements discussions.

2. DevOps

As we well know, DevOps is linked to the build lifecycle for software development. This term can be easily associated with DataOps, but DevOps methodology is only one of its components. Data analytics solutions always use a stack of technologies, and those tools are used by different teams on the same solution making it likely to have segregated data products but also some common components that need to be synchronized. That is why there is a need to “versionise” the code of those solutions, and besides that, these projects need to follow a structure where different approaches are made. There is a place where you develop your data pipelines, data models, dashboards, etc.; there is another one where you test the quality of them and another one, which we call Production, where you give the business users your solution so they can work. By following these best practices, errors can be reduced, and the solution’s overall quality can be improved.

3. Lean Manufacturing

As we spoke of analytics development and deployment, there is a part that is missing, the orchestration and management of the data pipelines. We need to see these data pipelines as manufacturing lines, and as we know, all companies in the world should carefully monitor their lines of production, especially their quality, mitigation of defects and efficiency times. When we speak of data pipelines, we speak about the real side of operations in data analytics. This means that we need to monitor each step of those data pipelines and do various kinds of testing to ensure the quality and transparency of data. When you have a system well-engineered built around your data pipelines, each set of data will be strictly verified, and if something is wrong, your analytics team will be alerted or notified before business users face the impact.

Final Thoughts

Data value is increasing, and much of it comes from the diversity of data captured and the possibilities of correlations. In this context, analytics solutions are becoming increasingly more complex but also more valuable. That case could be yours, and even if you are not there yet, you need to ensure your solution is future-proof, so you will use DataOps methodologies to achieve excellence and get the maximum value out of your data. As we mentioned earlier, data pipelines are like manufacturing lines, so it is key to ensure data pipelines are well monitored and organized. It is a matter of mindset, and the sooner you prioritize DataOps, the sooner your Data Journey will come true.

José MirandaDataOps and non-automated data processing
read more

Analytics Assessment: how to analyse a project’s viability

5-SECOND SUMMARY:
  • Discover the importance of carrying out an Assessment before implementing an analytics solution in your business;
  • An Assessment has several benefits, such as saving time and money and discovering challenges and answers for your analytics project.

Why should you do an Analytics Assessment?

Making the best of an analytics initiative can sometimes be a big challenge. Much is said about the action, but it’s the ‘discovery’ phase that will potentiate the success. Laying down a strategy isn’t that simple but comes with a lot of benefits that many cannot initially see. Discovery is the first stage of the process, where we define our data strategy and good practices and procedures to diminish the risks, time and costs associated with any transformational initiative such as a data project. To achieve this, an assessment should be performed to understand what we will need, what we can define and what must be done. But what are the main benefits of this?

Benefits of an Analytics Assessment

1. A personalised solution

The assessment is where the technologies and architecture for the project will be defined. This is true whether you’re starting from scratch or evolving from an already existing analytics solution. Analytics solutions can be created in many ways, depending on their specific goals. For example, is the system for internal use, or does it also need to communicate information to external stakeholders? Do you have near real-time use cases, or are they batched, etc.? Decisions are taken from a high-level perspective at this phase. Instead of settling for a general solution, decision-makers can personalise how they want things done, using the right tools for individual needs and problems. During this process, you will also define the necessary frameworks, used to accelerate the implementation and deployment of the project, granting quality standards.

2. Save money and time

The truth is, you end up having to make these decisions anyway, and the problem is that if you don’t make them in good time, you won’t make good decisions, and later on, making them out of necessity, the effort will have become much greater. This is because when you start a project without the right guidelines, once you define them, you find yourself having to revise everything that has already been implemented. Working like this, the chance of failure or forgetting something vital is enormous. Your teams will be held back fixing daily problems and become overworked and less focused on establishing best practices. In the end, you’ll feel that you can’t see the wood for the trees!

So, basically, when you embark on a project without proper planning in place, you do run the risk of finding that the process becomes far less efficient, even jeopardising the success of your analytics solution. You’ll have to spend unnecessary time and money re-engineering processes and due to not initially establishing a strategy, you will potentially come up with a solution that won’t even effectively address your requirements. Making a thorough assessment is done exactly to prevent such situations.

3. Know each other

An analytics solution always involves different stakeholders, most likely including multiple business departments such as IT, the management team and analytics specialists. Assessment opens the possibility of connecting all the intervenient parts. In the process, you’ll get to know what the perspective of every one of them is and define the best strategy and milestones so that, in the end you get an analytics solution that meets all expectations. The idea is to build a trust relationship where people work together towards a common goal from the ‘get-go’.

Final thoughts

An analytics assessment isn’t just a questionnaire; it’s a dialogue that will guide you towards the best approach for your goals. The benefits of this stage will prevent you from taking bad decisions and losing time defining strategies or processes during implementation or deployment. Besides this, by delaying implementation just a little bit longer, you will be able to start your project smoothly and effortlessly, with processes defined, risks highlighted, and solutions already prepared to mitigate likely problems to emerge from those risks. In the end, everything will be much more effective, and most importantly, you will build a robust analytics solution to enable you to get more value from your data.

José MirandaAnalytics Assessment: how to analyse a project’s viability
read more

7 key steps to implement a BI Strategy

5-SECOND SUMMARY:
  • There are 7 steps to implement a BI strategy in your company: Vision, Sponsor, Tools and architecture, Talent, Culture, Governance and Security and Evolution.

Nowadays, the market is highly competitive meaning that having a good BI strategy is the first step to achieving results and mitigating failures or wrong directions that can make you lose position or competitiveness.

Making a BI strategy is very important, especially when you’re going to implement it for the first time. There are some challenges and pains while doing it as some variables that you must take care of to prevent you from failing while implementing such a solution. It’s not easy to achieve a perfect implementation, but it’s not impossible, and we’re here to show you. Just follow the steps below, and we’re sure that you will perform great:

1. Vision

We would suggest that first of all, you must identify in which state your company is. How are you treating data? Where does it come from? Which processes and tools are being used? And which human resources can you take advantage of that have expertise in data?

After that, set up your priorities, objectives and goals that will bring value to your company and help achieve the better performance you’re seeking. Think of building a BI roadmap with future actions, milestones, deliverables and KPIs over a certain period, this may help you identify what is essential and the timelines for achievement.

2. Sponsor

Adopting a BI strategy will require resources and change management, and for this, you’ll have to find a sponsor for it inside your company, and that choice can be crucial. First, it will fund the change you want to implement in your company and second, you need someone inside your company to trust your work and support the project. Ensure that you involve your sponsor often, so he keeps trusting in your work and sees the results.

3. Choosing tools and architecture

There are pretty good BI tools out there in the market. But still, each of them has its advantages and disadvantages. Choosing a not so well fitted tool will make you lose money and time. Identify what will be the main patterns of your BI project. How and where will you fetch data, which type of treatment will data need and where will you store it after being cleaned, will you need more tabular analysis or charts analysis, and where do you want end users to access data and analysis.

These are some questions that you must answer first and after that search for tools and ask for demos so you can see the utility of those tools and if they fit what you want to do. Besides that, you must ensure that you have the right architecture for all the tools you need to use. If local machines or cloud, their performance and interconnection, which tool will do what and how will each of them connect to each other so the flow can be smooth and without major problems, and many other questions you can ask. A way to know the best tools in the market is by following the Magic Quadrant of Gartner published yearly.

4. Gathering talent

One of the most challenging points will be this one. Choosing roles and finding people to fill those spots, especially in a company that is not data-driven yet, will be hard to do. You can hire new people with data knowledge but who know nothing about your company, or you can take advantage of those you already have and simply train them. Maybe in the end it will be a mix of the two.

Implementing a BI solution requires different skills and specialisation so matching the internal resources with a partner is likely a good option.

5. Promoting Culture

If I said that the previous point would be one of the most challenging, this one would be equally hard. If a company is not data-driven or at least people don’t understand that things have to change and they must know how data works, then your project will fail. No one will be motivated to use BI tools because they won’t get anything from them; they won’t understand the purpose and value of such, something that in the end, will make them boycott the change you’re trying to implement. Make sure, from the start to yourself, your sponsors and all stakeholders that everyone must be trained, and ensure that you deliver data literacy and digital competencies to everyone in your company. Democratise data, let business users answer their questions and do analysis by themselves. Don’t just tell them the value of it; let them touch and see the future, and make them follow and want more.

6. Governance and Security

Data is something of great value but is something private too. You must ensure that your data is protected and only accessible to the ones that are allowed to access it. Assign people like data stewards or content administrators to check if all data is well stored and governed. Build policies and procedures for different scenarios, and guarantee that you are prepared for any leakage and data protection. You can extend this to your tools, and see how they are performing over their lifespan, if they are updated or if there are any improvements to them.

7. Evolve

Always believe that there’s no ending to what you’re doing. Data platforms are continuously evolving, and you must do the same; you can escalate your BI solution to use tools with Machine Learning or Artificial Intelligence capabilities in the future. Never forget that nothing is forever so always keep informed about data tendencies. Besides that, you won’t implement a BI solution to your whole company at the start, it will be for one department or one problem, so after being successful you may escalate BI to other departments or other problems where it may fit so that one day, you can call your company – a data-driven company.

Final Thoughts

As you see, implementing a BI solution will have its challenges, but you know as we know that it’ll be a game changer for your company. You’ll need a lot of perseverance, patience and know-how to manage conflict and expectations so that, in the end, the result may be on time and bring value to everyone and that’s why Xpand IT can help you with our service of the data journey. Besides that, we have teams highly specialized in these types of solutions which can advise you right from the start and bring all the necessary know-how.

José Miranda7 key steps to implement a BI Strategy
read more

Is my company Data-Driven? How to check your Analytics stage

This is the million-dollar question, in fact, for some companies, it could mean more. While pursuing the goal of becoming a data-driven company you can acknowledge the power of data to help you make the right decision at every point in time. But, how do you know if you’re on the right track? Happily, there are a lot of indicators and information to help with this evaluation. Knowing what stage your company is at can help underline what you must do to achieve the coveted ‘data-driven’ title. This leads to acknowledging what it takes to get there from different angles: how much effort is needed, how much in the way of resources must be spent, or even what competencies could be missing. In the end, the idea is to efficiently implement this process and become more competitive.

1. How much do you know about your data and who needs it?

To take advantage of analytics it is important that you know how data will be inputted and what data is available. How is data stored for the main areas of information that you need to work with – in files like Microsoft Excel or text, or contained in databases? How are these sources accessed nowadays? If you can answer these questions, then you have a good understanding of the data available.

Another aspect is knowing whom that data will be relevant to, who your end users going to be and in what contexts they will access that data. For instance, if one of your objectives is to get mobile access to content or data stored in the cloud, you need to know if your company has these resources. Find out which technologies are being used now and list the technologies you may need in the future to support the whole process.

2. How focused is your team on becoming a data-driven company?

When a company wants to go down the data-driven route, its people must be oriented that way too. Every disruptor must have sponsors, normally executives, who are open to change and who understand and believe in the benefits of the project. These internal sponsors will be responsible for ensuring that business processes frequently include data analysis and act as enablers. Make sure that your leaders are ready too and have the skills to embrace transformation. Find data champions, people who can work with data tools and share their knowledge with other end users.

It’s no use investing in a new process like this if you’re not committed to changing everyone and persuading them towards a digital and data mindset. If you want your company to be data-driven, you must spread the ideals, but don’t try to do it alone, believe in everyone’s capabilities.

3. Does your company have all the necessary skills?

Implementing an analytics platform will require different areas of expertise, ranging from data engineering to visualisation and even setting up infrastructure. Besides this, users will need training and regular workshops can help drive adoption.

Start by checking the proficiency of your end-users, whether you have an analytics department if there are any data champions and what skills are available. Implementing a data-driven path without specific skills will be very hard and may take ages to achieve. You can even jeopardise the whole process if you don’t anticipate user needs or simply don’t have enough quality data and undermine the confidence in analytics.

This is something hard to recover from because everyone must feel that it’s easy to interact with the platform and for this, they must be well trained and have a super-cool infrastructure where they can easily access these new functionalities without problems.

4. How can everything be governed and secured?

Last but not least, after analysing where your company culture is headed, after evaluating the data available and after defining all the players who will be involved, you must check how security is achieved and content is being governed. Is information divided by department or is it all held centrally to be accessed by all users? What can someone with a specific role view do? Will they only see specific information or be able to access all your content? These are examples of some of the questions you must look at.

Nowadays, low-code modern BI (Business Intelligence) tools like Microsoft PowerBI and Tableau have features and capabilities that satisfy these issues, which makes the job easier. With them, you can give freedom to your users to do whatever they want; see, edit and share content, etc., but always governed by what you decide they are able to do. In many cases, especially for larger companies, data is accessed to build dashboards with content that can be shared to specific roles across the whole organisation. Without a good governance model, it’s really hard to achieve a streamlined process where content is quickly accessed, updated when needed and safely shared.

Final Thoughts

Sometimes it’s hard to evaluate what stage your company is at, and this is why today we are giving you some insights and advice. The term ‘data-driven’ is becoming ever more popular and better understood in the business world, but many companies don’t know where they stand and what they should do.

The actual steps you need to take to become a data-driven company will depend on your unique organisation set-up and where you currently stand. We want you to know where you are, what you have and what you need to do, and this is why Xpand IT created the Data Journey concept, detailing all the steps required for success. We can help you evaluate, design and deploy a sustainable initiative to pursue and achieve a data-driven culture, making sure you have all the necessary skills available and someone with a high level of expertise assessing your needs. The objective and final outcome are to promote the success of one of the most important aspects of your company’s digital transformation.

José MirandaIs my company Data-Driven? How to check your Analytics stage
read more

Cloud Analytics solutions with Synapse

5-SECOND SUMMARY:
  • Microsoft Azure Synapse came to change the game: companies can now be more agile by centralizing analytics work in one place;
  • In this article, we’re going to focus on the SaaS solution for implementing a full Azure BI solution.

Cloud solutions and in particular Software as a Service (SaaS) bring several advantages such as how easy it is to get started, and all the features available enabling us to be more agile and cope with business changes. In this article, we’re going to focus on the SaaS solution for implementing a full Azure BI solution. Azure SaaS solution would mean your users would access all their work on the internet through a provided website or app instead of installing them on local machines as we’re going to see.

So how would that work? Everything begins in the same place as always – data sources and databases.

1. Storing data with Azure Data Lake Storage (ADLS)

After you define where your data comes from, you’ll see that some of it come from databases that you may have already, files or other data sources. For that, you have Azure Data Lake Storage, which is like a cloud file system where you can store any object you want. It is very easy to integrate with platforms and programming languages, giving it the capability of storing data coming from anywhere and establishing security.

In short, Azure Data Lake Storage lets you have all your data sources integrated into one place, storing them together and building your data lake.

2. Processing data with Synapse

Synapse is an all-in-one data & analytics platform that combines data ingestion, big data, data warehousing and ETL processes in the cloud. With it, you can fetch your data from ADLS, clean it, treat it and store it in your databases or lakes which allow all your separate processes. This is because Synapse integrates a lot of applications from Microsoft like Azure Data Lake, Azure Data Factory, etc. making it a really powerful tool when it comes to working models. Why? Because Synapse makes your work much more comfortable since you don’t need to work separately on your database application (SQL Server), ETL tool (SSIS) and visualization tool (Power BI). Even for versioning and DevOps of your projects, Synapse can stack really well because it is fully integrated with Azure DevOps allowing you to seamlessly manage all artefacts. Besides this, you can have a place where you can monitor everything that happens with your data from the beginning to the end. On top of this, you can evolve your process to use machine learning algorithms because Azure Machine Learning can be integrated too.

Without a doubt, there are many benefits of a tool like Synapse, and the empowerment it can bring to companies that want to raise the bar on their data journey is immeasurable.

3. Visualization with Power BI

Being able to analyze data is crucial, and nowadays, you have tools to build fine charts and tables with everything you need to know. But what is Power BI? It’s the place where you can build reports or dashboards with all the data that has been talked about in the previous points, so you can make your decisions based on facts and not only guesses. In an Azure solution, you still have to create content on Power BI Desktop, but everything else will be made on the cloud so, all the maintenance and editing can be done in the Power BI service workspace, which you can easily integrate into the Synapse studio.

Basically, by having that integration, in one place, you can fetch and store data, and process and present it through interactive and dynamic dashboards.

4. Cataloging data with Purview

Purview is a data governance tool that helps companies govern and manage data. You can use Purview to catalogue all data from your data sources and manage sensitive information or tag it allowing you to streamline the process and make it automatic.

Another feature you gain is to see the lineage of your data and know where it comes from and where it goes so you can track how your processes are going. These are valuable advantages you can obtain by using Purview but there is more – by having everything catalogued, all users in your company can access that catalogue to explore and find insights or check for sensitive data.

Guess what? Purview can be integrated with Synapse and from there call all the features to work with everything in the same place.

Final Thoughts

Things are changing, the cloud is becoming the new king, and although the market is really vast, betting on cloud analytics with Azure Synapse came to change the game. With it, companies can be more agile by centralizing analytics work in one place. For those who need to open their database manager, their ETL tool and their visualization tool, Azure Synapse understands that having all three in one place leverages their work tremendously because having everything together leads to a better-managed project with fewer errors, version problems, compatibility issues, and many other situations that are mitigated with Synapse. All that, plus having the capability to catalogue and lineage data, makes this tool even more complete, ensuring proper governance.

The improvement of competitiveness for companies using Synapse is a game-changer. You may have a BI cloud solution with different types of tools and all of them scale very well but you can clearly see the benefits of having a tool that can potentiate the management of all BI processes in the same place with everything integrated. This makes the whole process easier and agile which, in the end, brings more value from data that’s easily handled with new business drivers.

José MirandaCloud Analytics solutions with Synapse
read more

Lumada Data Catalog: the solution for data organisation

5-SECOND SUMMARY:
  • What is Lumada Data Catalog and how to take advantage of this new tool;
  • How to catalogue, organise, control sensitive data and manage redundant data, and also, how to manage all the owners and stewards in your data catalogues.

What would you do if you knew that the way you organise data could be greatly improved? The information gathered from the existing inputs to your company gets bigger every day, and in a way, you need to treat that with big data tools and processes. However, as time passes and the data you store gets wider, the risks of having everything unorganised and losing track of what’s happening increase. This may lead you to spend human hours trying to discover what you want to analyse or being out of bounds in terms of sensitive data compliance. In truth, how can you be data-driven if, in fact, you can’t find data?

Information is everywhere, which we then turn into efficient accessible knowledge by organising and categorising by subject. This happens with books, presentations, code, any other type of information, and now, with data. By cataloguing the information you retrieve from your company’s inputs, you can label and easily find the data you want to work on to prevent the risks we spoke about before. One of the tools that give you the power to achieve that is the Lumada Data Catalog. This Hitachi tool lets you catalogue your data using artificial intelligence and machine learning algorithms that give labels to your data and validate those tags with statistical evaluations, which you can then confirm if they’re right or wrong and teach the algorithm how to perform with your data. But what can you really do with this tool and what value can you retrieve from it? Let’s look at the facts:

1. Organize & Discover Data Quickly

Having all your data catalogued is like having an index for it. You can access and discover specific blocks of information by using the tags functionality. How does this happen? The Lumada Data Catalog uses an AI process that populates your data catalogue automatically, reducing the need to manually discover and tag data because, for huge amounts of information, manual discovery is not manageable anymore. After that, you can accept those tags or add new ones, such as the ones you like to use or your business terms, to classify your data and make the AI process do the rest for you. This gives you the ability to have all your data inventoried and you’ll just need to search for the specific tags you want.

2. Control Sensitive Data

While identifying and tagging data, the Data Catalog AI process will automatically get all of the sensitive data it can find and give it the proper label. If there were other data fields you would like to label as sensitive, you would just need to give the same tag to them. This gives instant knowledge and the ability to maintain your company’s compliance with data privacy regulations.

3. Manage Redundant Data

Maybe you don’t notice, but it’s really easy to have redundant data. Normally the way you know that is when you have the same field coming from different places and you don’t know which one to use. Having your data organised and catalogued you can recognise when you have redundant data and where it comes from, which helps you quickly manage this kind of inconvenience.

4. Owners and Stewards

When you have a data catalogue it’s like having a library and as such, you must have someone guarding everything. That’s why you have owners and data stewards. These roles maintain and manage your data catalogue and help your end users every time they have a doubt or need to find something. By having these people you’re giving a contact point to everyone in your company regarding any matter about data.

Final Thoughts

It’s clear that having a data catalogue can really improve the way you treat and share data across your company. Besides that, treating your sensitive data properly and having specialised people managing your data, with whom your end users can talk, and following procedures is the right way of working as a data-driven company. The Lumada Data Catalog can improve this process even further by using AI and machine learning technologies that let you organize everything automatically. This can bring faster insights and decision making to your company and leverage your capability of being competitive in today’s markets.

José MirandaLumada Data Catalog: the solution for data organisation
read more

3 successful embedded analytics trends to follow

Now, more than ever, the world understands the value of data and the infinite possibilities it gives to those who make decisions. If your company provides any kind of service, with great probability you collect data; and if you don’t have any strategy for managing it, then you’re missing out. The opportunities you can find in the data that your business’s daily activities generate can be huge and when you see the power beneath it, you’ll want to use it. We’re talking about giving your customers even better value based on their own data. We’re telling that you can monetise even more of what your services are producing. We want to stay simple, so today we’re going to talk about these 3 possibilities, 3 successful embedded analytics trends, and how you can achieve them with Tableau. Let’s see:

1. Improve your services with embedded analytics

Being free to implement your analysis wherever you want, is really a great help to achieve what your clients envision. You can embed Tableau Server or Tableau Online in solutions that you can then provide to your clients. This means you can build all the reports you want in Tableau and then integrate them into every product, service, web portal or app that you want. The power you earn to personalise your offering is massive and will make your clients feel they can have their own analytics instead of a standardised one. Beyond that, this functionality can improve your actual services or give them an extra layer, a so-called “extended product” where you can augment your service package according to the needs and wants of your clients or what you think may be better for them. So, it’s clear that this can give you great agility building personalised solutions for your clients and beyond this, you can do it while enjoying the best of Tableau’s capabilities.

2. Monetisation

Everyone praises data now. The market understands its inherent value and the companies who treat and monetise their data are the ones leveraging it for their businesses. Although it helps with making better-informed decisions, based on facts instead of predictions, data can become a service or a product in itself and there are a lot of options and approaches for that. After having embedded your solution, if your company works with client data and you want to give them insights using dashboards, especially the ones you build in Tableau, you can create products or services around them in order to monetise the insights and the value you can retrieve from those analyses. Moreover, you can give each client a personalised or standardised solution, with the personalised solution being more expensive.

3. Build vs. Buy

Of course, you could build your own solution, but buying is often the better option. Why? Well, if you choose to build, you’ll start from scratch and your solution will probably be based on a complex process that needs lots of maintenance and people’s attention to be focused on doing analyses and preparing reports. This means it will take a significant amount of time before you start adding value and besides this, the feature set available will always be limited by your development capacity.

Tableau has been on the market since 2003, so it’s clear that it has had tons of time spent on developing and perfecting its ability to build cool reports. If you choose to buy, you know that is the only cost you’ll support to access years of knowledge. Besides this, it will take much less effort, and setup will be faster, as you won’t need people to develop and maintain the solution because you’ll be able to direct people to focus on analyses and reports. Implementation will be way easier and you’ll be building reports that can be easily changed over time in Tableau.

Final Thoughts

Embedding analytics is a powerful capability that Tableau offers. Using reports that can be easily built-in Tableau on your apps, products or services can open a new world of opportunities where everyone wins and value is created. This is part of what digital transformation is about and we are here to help you on that journey. Take a look at our Tableau solutions and get in touch with us; we’re here to help you establish a strategy to implement the most successful embedded analytics trends, so you can use your data analytics in the right places, with the right people, in the right way.

José Miranda3 successful embedded analytics trends to follow
read more