José Miranda

jmdm

Data Engineer - Xpand IT

And the winner is… modern BI!

Why ‘modern Business Intelligence‘ is so important for your organisation in order to become more competitive?

Modern BI gives you the flexibility to build a data-driven culture where you can make decisions based on facts rather than guesses or assumptions. Instead of relying solely on EDWs (enterprise data warehouses), like traditional BI, it comes with a set of new visual interactive tools to tackle all kinds of tasks from IT to workflow. BI is no longer just a project; the goal is now a data-driven company in which BI connects data with its end users through ETL (extract, transform and load) and visualisation tools. What we want here is to demonstrate how modern BI can bring value to your company and we’ll do that via the following trilogy.

1. Accessing data

Connecting to data has become so much easier. Nowadays you can connect to every type of DB (database), to a set of files, like PDF or excel, and to APIs or data from the web with web data connectors, etc. You can do this from a BI tool such as Tableau Desktop or Power BI, which let you connect directly to these data sources. Think about it; many companies rely on Excel as an output for their departmental information. Imagine that you prepare monthly report files on sales figures. How best can you compare your sales performance for 2008 against that of 2018? Are you going to open all those Excel files? How can you build a sales vs region map by year? And drill down to data for every month? Well, fortunately, modern BI tools can give you all this. You get the capability to quickly connect your Excel file, or a load of Excel files (by joins or relationships) to Tableau or Power BI, which means you’re acquiring a real upgrade of analysis efficiency because in a matter of minutes you can clean, normalise and use all the data to build dynamic reports and dashboards.

Bear in mind that sometimes data isn’t completely error-free, so a cleaning process must be carried out, which you can do easily in the tools mentioned above with just a few clicks. However, if you have many complex files, which need to perform complicated calculations, or you want to join too many different data sources, you’ll need an ETL tool like Pentaho, Tableau Prep or SSIS (SQL Server Integration Services) and a database into which your ETL can drop the data from all those sources.

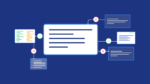
2. Building visualisations

All right, connecting data has new fancy options and is now much faster, but the coolest thing is building the visualisations. Forget those old static charts and tables or maps. Nowadays, BI solutions give you the ability to construct every type of graph to display information exactly as you want. Using a single graph, in few minutes, you can create a visualisation by year with the possibility of drilling down to individual days; or you can drill down by hierarchies, for example, showing profit first by product group and even further until you reach profit by individual product. You have the ability to incorporate filters into your visualisations in order to be more precise with your analysis. You can build parameters to enable you to see different KPI’s (key performance indicators) by groups of products meaning that in the same visualisation, you can explore profit or number of sales or margin by product. Nevertheless, you can explore raw data by creating tables with all the information you need.

Alongside these cool attributes, there’s another important functionality. You can explore and analyse all the underlying data. Choosing a group or clicking on a specific point on your graph, you can promptly see the information behind the values. With this, you’re never working blind, and guess what, you can export these pieces of data to file. Using this functionality with the visualisations, you can do your own exploration and analysis in which you’ll be able to find trends or outliers and take interesting conclusions.

You arrive at a place where you’re able to create views that you can group in a super-dynamic dashboard full of filters and parameters that can be applied to all your graphs, tables and maps. With dashboards, you can create data stories where you tell a story using snapshots of a specific dashboard to communicate data much easier and more consistently.

It gets even better because after constructing visualisations you can then share them with everyone in your company and decide who sees what.

3. Governance

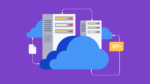
If the visualisations are cool, imagine how awesome it is to easily share content with anyone in your company. Tools like Tableau or Power BI give you the opportunity to bring all your content together in one place, divided by project or department. We’re talking about your data sources and dashboards in which you can create groups of users and decide their permissions. Imagine that you build a marketing dashboard and publish it via the online service. You have users in all your company’s different departments but you only want those in marketing to be able to see this dashboard. To achieve this you create a group called Marketing, add all your marketing users to it and grant them permission to see your content, while for other groups, such as Finance, for example, you deny permission.

The online service is managed either through a physical server or based in the cloud, with a high level of security. To connect, you can use login directories such as Active Directory, or you can create one locally. You can embed your interactive visualisations into webpages, which will refresh any time that you change the underlying data. Defining schedules and alerts is something you’ll find really useful. Schedules for refreshing data, for example, and alerts for when a KPI reaches a specific limit. Despite this, you are able to monitor everything: who has accessed what, performance, space usage, tasks, etc.

The best part of all of this is the fact that your IT personnel are still an important part of managing access to data, but with the right software, every user is empowered to view, customise, create and edit dashboards and reports or analyse data in far less time.

Final thoughts

As we said, BI is no longer simply a project. BI is a living being in your company. Imagine your company as a city and BI as a data speed highway flowing freely between every corner of that city. Scalability becomes very effective as you can upgrade your departments to the digital culture in less than no time or upgrade your old digital BI structures, which will then become even faster.

The given value of monitoring, making decisions, analysing information quickly or sharing insights between people and departments is one of many other strengths that BI can offer you, although business users become more autonomous to do so.

For sure, modern BI is a winner that caught the speed of our fast, competitive, changing world and earned its place right next to business fabric, and this is how XpandIT DIaaS (Data Innovation as a Service) became real. By defining your strategy, deploying, maintaining and supporting a robust data solution, and helping you build your speed highway, we can help you define the process of positioning yourself as a competitive data-driven company and of course, a winner because when you win, we win too!

José MirandaAnd the winner is… modern BI!
read more

Green Deal: 5 reasons to become a data-driven company

Let’s face the truth, sooner or later every industry will have to comply with ecological directives, whether they come from the European Commission or another organisation with a similar kind of influence.

In fact, as many of you know, in December 2019, the Commission published a white paper called “The European Green Deal”. This deal had the purpose of changing the way European Union (EU) and all of its citizens cherish our climate and environment.

It isn’t hard to understand that European companies will have to be the earliest pioneers and data-driven companies will most easily adopt such directives. Therefore, if you want to stay competitive and quickly absorb the coming changes regarding production or daily operational processes, you should give a data-driven business model a try.

Why? Because you’ll be able to analyse and take actions knowing exactly what’s happening with your day-by-day operations instead of just making assumptions. You’ll have data organised in digital infrastructures allied to Business Intelligence, Data Science and Big Data solutions.

For you to understand this better, we’ll analyse 5 points, but this comes with the warning that the deal contains an incredible wealth of information and here we can only focus on those parts that matter for the purposes of this article. However, we advise strategic managers to read the Green Deal.

1 – Clean, efficient energy

According to the Deal, 75% of the greenhouse gas emissions in the EU emanate from the production and consumption of energy by economic sectors; so in order to reduce those numbers, power sources must become built around renewables and must work towards being 100 percent digitised and structurally interconnected throughout.

As a data-driven company you’ll know precisely what is being consumed and exactly how much. For example, you will be able to understand if you’re using renewable resources or not, how much electricity is spent, how much water is being used or how much heating and air conditioning is wasted. Better strategies can be built by evaluating the consumption required by day-to-day operations and evaluating whether they are running efficiently and what resources they required.

2 – Clean, circular economy

Only 12% of the materials used by EU industry are recycled and, the extraction of new materials tripled between 1970 and 2017, is still rising and represents a global risk. Because of this, in order to achieve Green Deal objectives, the Commission want companies to embrace ecological and digital transformation and be more independent of the requirement for new materials, which are converted into products and then disposed of as waste or emissions. In fact, the Deal reveals that the Commission’s priority is to reduce the use of new materials and improve their reutilisation, reserving recycling as a third plan.

As a data-driven company, you’ll be capable of monitoring production lines and retrieving data in order to analyse the amount of resources used to produce any item or measure (in tonnes, for example), which materials are being used and how much waste is being generated. With this information, you’ll be able to redirect production lines to ecological purposes, using materials more efficiently and producing less waste or optimising recycling. Besides this, having a digital view, you can become a role model in your industry by developing efficient models and innovating ways of producing products in a disruptive way.

3 – Construction and buildings renovation

The rate of annual building renovations in the EU is between 0.4 and 12%. The Commission states that this rate must double in order to achieve climate objectives. On the other hand, millions of consumers fight to keep their homes warm. To solve this problem, the Commission will encourage the renovation of private and public buildings, tighten energy efficiency legislation around building and follow the circular economy logic by increasing the digitalisation of housing stocks. The Commission will also review Construction Products Regulations.

As a data-driven company, you’ll have the data analysis tools to give you insights into what materials are used in every project and where to use better materials if needed, so that buildings have lower energy consumption. Getting an intimate view of how construction is carried out and having data on the effectiveness of every material used, you will easily comply with coming changes on energy efficiency legislation.

You’ll know how to organise stocks efficiently in order to reduce waste.

As a company linked to construction, you will be able to design solutions to retrieve data about consumptions and energy efficiency to houses or buildings owners. You will also be able to build intelligent houses that climate efficiently using smart windows and temperature balance systems with air purity and circulation or houses with vertical garden for air renovation, humidity prevention and acoustic renovation. This applies to both new construction and buildings renovation.

4 – Sustainable mobility

According to the Deal, to achieve climate objectives, transport emissions should be decreased by 90%; and by transport, they mean all types (cars, planes and boats, etc.). To address this, the Commission will create a strategy for this challenge that strikes at all these sources of emissions.

As a data-driven company you will be able to control your fleet with devices that provide information on consumption and emissions for every vehicle. With this data, you can rethink strategies and change your fleet if necessary (from diesel to electric power, for example) or redesign routes to reduce mileage and emissions.

If you are a transport industry manufacturer you will be able to get consumption, emissions and efficiency data from your engines and others parts of your products, which will tell you precisely where something isn´t so effective. You’ll be able to understand the performance of your products and what to do to reduce emissions, even if it means less power.

The same applies to battery manufacturers. You’ll be able to retrieve data on the relative performance of your batteries and the exact materials that go into producing them. This will give you in turn ideas on how to extend your battery lifetimes or develop efficient production lines producing lower emissions, which could encourage your customers to switch from fossil fuels to electric fleets.

5 – Healthy, environmental-friendly food systems

Producing food pollutes the air, water and soil, affects climate change, contributes to the degradation of biodiversity and consumes too many natural resources when that food is wasted. Nowadays there are new technologies, discoveries and public awareness that can present new opportunities to producers and value to stakeholders. To change the way in which food production pollutes our planet, the Commission has developed a “Farm to Fork” strategy. Furthermore, their proposal defines that at least 40% of the Common Agricultural Policy’s overall budget and at least 30% of the Maritime Fisheries Fund would contribute to climate action”.

As a data-driven company you will know exactly how much water is used on your farms, how much water and grass your livestock require and amount of chemical pesticides, fertilisers and antibiotics used, as well as many other important facts. This allows you to devise new ways of operating using lower consumption of resources and less chemicals in food.

The future has to be different, so it is just a matter of time before your company is forced to change its strategies and find new ways of producing clean, sustainable products. The data you get from your farms, vineyards, greenhouses, aquaculture, etc., married to data on your customers’ needs and choices, will become essential to helping you achieve the Green Deal objectives.

Final thoughts

We’re speaking about a massive transformation over the next 30 years, and we believe that companies averse to change will live hard times. Environmentally friendly, sustainable companies will be ever more valuable in the coming years. We cannot forget that new generations are growing increasingly aware of environmental and inequality problems. They are the ones who will force their employers and their parents to change their behaviours. They are our up-and-coming consumers and the ones to listen to.

Europe knows the future exposes new environment-friendly paradigms and wants to become the pioneer of these patterns, not only for future competitive and economical purposes but because it is mandatory.

A good way to discover where to go next is to know where you came from, which means that one way to understand where your company needs to go in the future is to analyse your daily data and understand exactly what you’re doing at present. You’ll need to be strategically well informed and capable of joining valuable information to help build future strategies and policies.

A great way to become a successful data-driven company is to get the help from a data specialist partner who understands Business Intelligence, Data Science and Big Data services, like we do at Xpand IT, and who can provide you with a DIaaS (Data Innovation as a Service) solution to guide you on your journey to becoming a data-driven organisation.

Your solution evolves over time and goes from those first steps of building and setting out your strategy, on to the implementation phase with its analytics and data science components and finally to maintenance, training and support services. You will end up with quite a set of automated processes, that will enable you to take more from data and in the end be so much more efficient; This is in fact a noble cause, as in the end, you will also be fighting climate change – and we are here to stand by your side.

José MirandaGreen Deal: 5 reasons to become a data-driven company
read more